

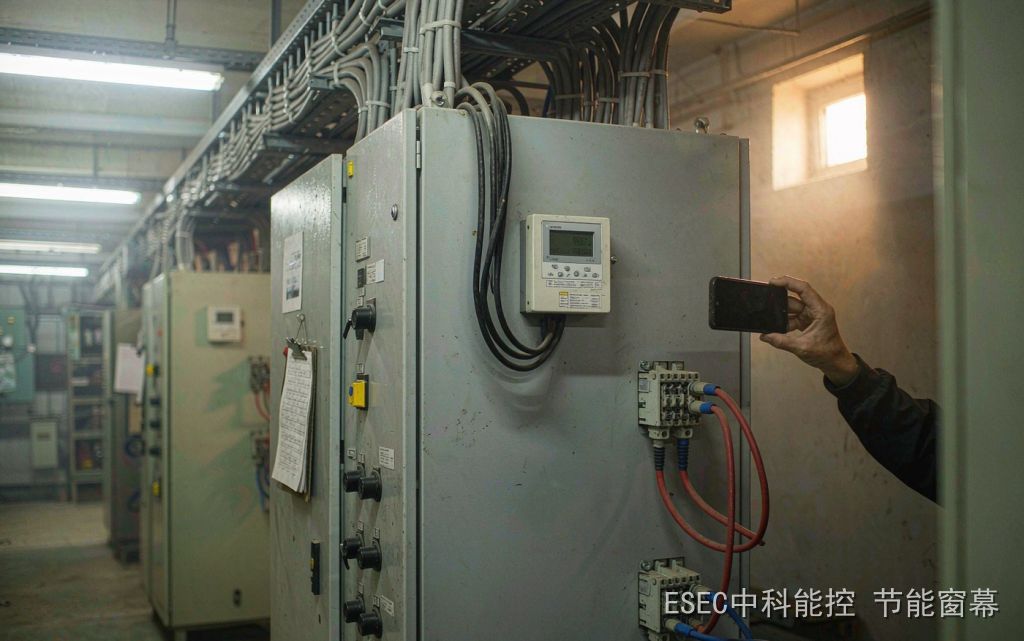
At 12:27 on 31 July, the Beijing grid carried a load of 28.151 million kilowatts. At that same hour, in provinces where solar output peaks at midday, spot power is often at its cheapest for the day. Both statements are true. That gap is the curve a glass building now has to look at.
1. After 1 March, the timetable for power prices is no longer issued by the government
1.1 Article 35 changed one sentence and unsettled a habit of fifteen years
On 17 December 2025, the National Development and Reform Commission and the National Energy Administration issued the Basic Rules for the Medium and Long-Term Electricity Market, document 1656 of 2025. It took effect on 1 March 2026 and runs for five years. Article 35 reads: for entities trading directly in the market, time-of-use price levels and periods shall no longer be set administratively; for users served through grid agency purchasing, the government price authority shall coordinate and optimise peak and valley periods and the price floating ratio, with reference to spot market price levels.
The weight of that sentence only becomes clear when it is put back against the previous fifteen years. The anchor for the last round was document 1093 of 2021: where the system peak-to-valley ratio exceeds 40 percent, the price spread should be no less than 4 to 1; elsewhere no less than 3 to 1. The government divided the day into peak, flat and valley, and fixed the spread. Building owners built a whole routine on top of it. Shift the load. Run at night. Charge the thermal store. Move the heavy work to the hours after ten.
Every one of those moves assumed that next year timetable could be obtained this year and planned against. That assumption is gone. Periods form in the market. Spreads form in the market. Laying out an annual peak-valley table in advance has itself stopped working.
1.2 Abolishing the fixed time-of-use schedule is not abolishing time-of-use pricing
This needs saying plainly, because it is the most common misreading: that everything will now cost the same around the clock. Peak and valley still exist physically. Solar output floods in at midday and retreats in the evening. Supply and demand still rise and fall. What changed is who draws the periods and who sets the spread.
The awkward part of the old system sat exactly at midday. Han Fang, deputy director of the planning department at the China Electricity Council, put it directly in a public explanation this July: at noon the sun is strong and solar generation surges, so by any logic power should be cheap, yet the fixed schedule classified midday as a peak period, which made it expensive. The price signal was distorted. That is also why, after the fixed schedule is withdrawn, some provinces may end up with a steeper curve than before: very low at noon, very high in the evening.
For a glass building, the practical consequence is this. The old rule of thumb, avoid running equipment in the peak period, may next year point at a completely different hour of the day.
1.3 Who is not in this reform
The scope has an edge, and the edge is clear. It applies only to industrial and commercial users trading directly in the market. Households, agriculture, and public-interest consumption such as schools, government offices and hospitals continue under the existing catalogue tariffs and government-set peak-valley policy. This round does not touch them. Small and medium users served through grid agency purchasing are handled separately: their peak and valley periods and floating ratios are still optimised by the government price authority against spot price levels.
The ones actually pushed into the market are the larger industrial and commercial users buying through retail suppliers. A second yardstick runs in parallel on the administrative side: public building energy grading governs ratings and assessments, which is a different matter from tariffs, but on the same building the bill and the rating tend to be asked about in the same conversation.
Progress varies by province. According to a review by Yicai in February this year, eleven provinces and municipalities had issued notices; nine had explicitly withdrawn the government-set time-of-use tariff for market entrants, namely Guizhou, southern Hebei, Hubei, Shaanxi, Jilin, Yunnan, Chongqing, Liaoning and Henan, while Jiangsu and Shanxi were still working through their proposals. Jiangsu then moved first from a different direction, cutting in at the retail contract rather than at the period table. That route is more direct.
2. The October guideline: the locked-price volume is gone
2.1 A guideline issued on 15 October
On the evening of 15 October, the Jiangsu Power Exchange Centre issued the 2027 Working Guidelines for the Jiangsu Electricity Retail Market. It was reviewed and voted through by the Jiangsu electricity market management committee, agreed by the government authorities in charge and the regulator, and took effect from the date of issue.
Three things were removed, and each deserves a look: the fixed-price volume ratio, the spot-market-linked volume ratio, and the proportional sharing arrangement. Fixed pricing here means the clause in a retail package under which an agreed share of consumption is settled at a unit price locked in advance and does not move with the wholesale market. That mechanism ran for years, and owners valued it above almost anything else in the contract. Lock a portion, and you know where you stand.
2.2 Three components in the new formula
The new retail package energy price is written as one line of addition: wholesale market price, plus floating price, plus the K sharing coefficient multiplied by the monthly shared cost.
The wholesale market price is determined by the blended time-of-use purchase levels of all retail suppliers across the medium and long-term, day-ahead and real-time wholesale markets. The floating price and the monthly cost-sharing coefficient are agreed between the retail user and the supplier on top of that wholesale price, and the two sides may still agree whether time-of-use applies at all. The K term is the coefficient that allocates deviation costs back to users.
In one sentence: the entire energy volume now floats with the wholesale market, and no volume is price-locked. The supplier no longer absorbs a slice of the spread on your behalf. The risk moves from who signed the contract to how the clauses are written: how the floating price is set, how K is calculated, and how the monthly shared cost is verified.
2.3 The first question from your supplier will change
The first question used to be how many kilowatt-hours do you use in a year. Now it is more likely to be what does your curve look like: when it rises, when it falls, how high the peak goes, how far summer sits from winter, how far Monday sits from Saturday.
Behind that sits a plain fact. The cost of a building can no longer be described by one annual consumption figure. November is the month when 2027 contracts are negotiated. Asking the property team for fifteen-minute load data at this point is worth more than haggling two fen off a unit price. Without the data, you are negotiating blind.
3. Four lines on the bill, and only one of them watches the clock
3.1 Energy charge: watches the period, and the market
This is kilowatt-hours multiplied by a unit price, with the price set by period or by spot. It is the part the reform changes, and the part everyone discusses.
3.2 Demand charge: watches the worst fifteen minutes of the month
On the bill of a two-part industrial or commercial user there is a line called the demand charge. It is billed monthly on the maximum demand of that month. The meter records maximum demand as the highest fifteen-minute average power, and installation conventions differ slightly between regions, so the local grid company explanation governs. It does not look at how many kilowatt-hours you consumed. It looks at where your worst single interval landed.
The unit rate for this line has been published province by province for the fourth regulatory period, under document 1077 of 2026, effective 1 August 2026 and running three years. Five provinces, all at the 1 to 10 (20) kilovolt level for two-part industrial and commercial users, compare as follows:
| Grid | Demand charge (CNY per kW per month) | Capacity charge (CNY per kVA per month) |
|---|---|---|
| Anhui | 46.4 | 29.0 |
| Hubei | 42.0 | 26.3 |
| Fujian | 40.0 | 25.0 |
| Hunan | 35.4 | 22.1 |
| Sichuan | 35.0 | 22.0 |
The five sit between 35.0 and 46.4, a spread of roughly thirty percent. The same building, placed in a different grid, faces a bill that differs by thirty percent. Which is why the calculation below uses only an order of magnitude, around 43, and why any real number must come from the local published transmission and distribution tariff table.
One boundary, drawn early: the two-part logic has been tried on heat tariffs too, but the heat account and the electricity account should not be mixed. Whether a heat bill is charged by metered heat or by floor area follows a different rule set, and the two-part heat tariff piece took that apart. This article is about electricity only.
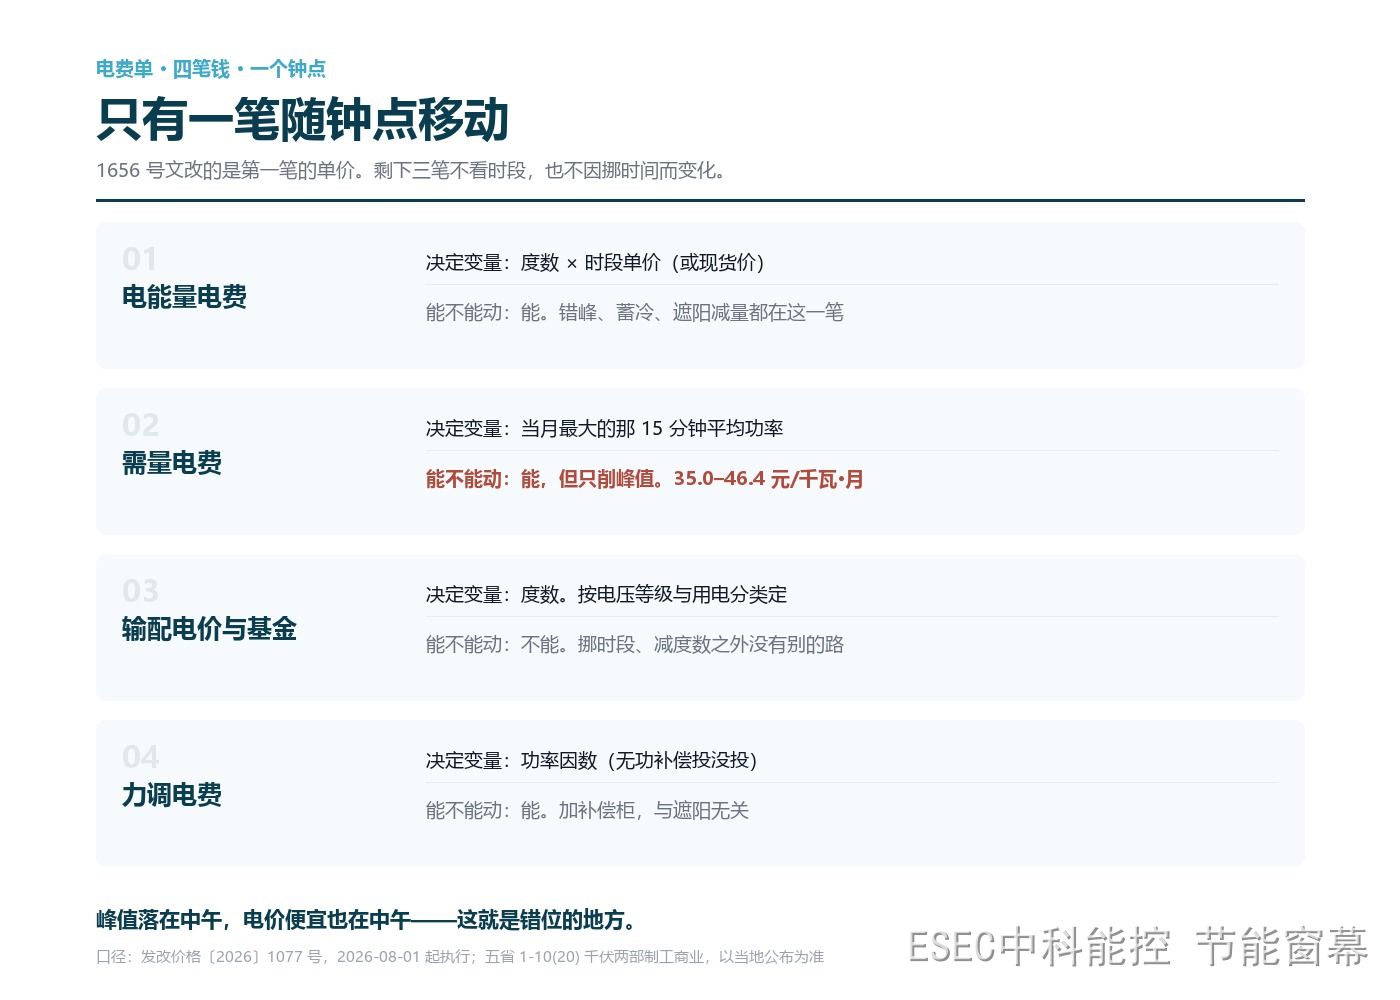
Of the four, only the energy charge has a unit price that moves with the clock. Demand, transmission and distribution, and government funds do not look at the hour at all. That is the foundation under everything that follows.
3.3 Transmission and distribution plus government funds: charged per kilowatt-hour
The energy portion of the two-part tariff at the 1 to 10 (20) kilovolt level in Hubei is 0.1065 yuan per kilowatt-hour. Government funds and surcharges are charged per kilowatt-hour as well; in Hubei the rural grid repayment fund is 0.02 yuan, the reservoir resettlement support fund 0.0062 yuan, and the renewable energy surcharge 0.019 yuan, totalling 0.0452 yuan per kilowatt-hour. Shift your load however you like, none of these move by a fen.
3.4 Power factor adjustment: two sentences, no more
Below the assessed power factor you pay a surcharge; above it you receive a small reward. It has nothing to do with the hour and everything to do with whether reactive compensation is switched in. That is an electrical engineering matter, and this article leaves it there.
4. The peak lands at midday
4.1 28.151 million kilowatts, at 12:27
At 12:27 on 31 July 2026, after days of hot and humid weather, the Beijing grid reached a maximum load of 28.151 million kilowatts, close to the historical record. State Grid Beijing activated its heavy-load warning response and applied 253 grid operating adjustments that day. The Tongzhou and Haidian district grids set all-time highs; Mentougou, Fangshan, Pinggu and Yanqing set summer highs.
4.2 Cooling is more than forty percent of it: the peak is delivered by the sun
Zhou Yunbin, chief engineer at the State Grid Beijing dispatch control centre, described the cause that day: the main reason is the obvious growth in air conditioning and other cooling load, which accounts for more than forty percent.
Beijing is not unusual in this. A 20 July analysis by the State Grid Energy Research Institute noted that national electricity load reached 1.551 billion kilowatts on 14 July, a record, with 1.252 billion inside the State Grid service area. One driver was high temperatures pushing up air conditioning load: cooling accounts for nearly thirty percent nationally and more than forty percent in some provinces.
Put another way, a large block of the system peak is heat that the sun delivered through windows and that chillers then carried back out. It is not an equipment efficiency problem and not an operations problem. It is what the envelope gains in that hour.
4.3 The price signal and the load peak are out of phase
The Shaanxi Power Exchange Centre noted in a market advisory this year that under spot pricing the lowest prices may appear more often during periods of heavy solar output. That is a statement, not a recommendation. Set it beside the time stamp above and it becomes an interesting question: the cheapest hours of the day are precisely the hours of highest load and greatest need for shading.
So the logic inverts. The old habit was to follow the tariff table and move load. The new one is this: the less certain the price, the more important it is to hold down the one peak you can actually determine. If you cannot hold it, the cheap hours will not help much, because the most expensive interval on the bill is not charged by the kilowatt-hour at all.
5. Holding the peak down: one calculation using published rates only
5.1 Step one: what is one kilowatt worth
Take 43 yuan per kilowatt per month, the midpoint of the five-province range, and a cooling season of six months, May through October: 43 multiplied by 6 gives roughly 258 yuan.
One objection has to be dealt with here. The demand charge is billed every month of the year, twelve times. Why count only six? Because shading changes the peak only in months that have sun and cooling load. In winter the peak is set by heating and lighting, and this window has little to do with it. Counting twelve months doubles the figure, and a number like that does not survive a question.
5.2 Step two: how many kilowatts can 1,000 square metres of west glass shed
Every assumption is written out below, none omitted:
- Incident solar radiation on the glass at the peak hour is taken as 600 watts per square metre. That is a common magnitude for a west facade on a summer afternoon, not an extreme, so the result leans conservative.
- The solar heat gain coefficient of the glass is taken as 0.4. Ordinary insulating glass and single-silver low-e roughly fall in that range. GB 50189 sets SHGC limits for curtain walls by climate zone and window-to-wall ratio, so check the design figure against it.
- Heat gain equals 600 multiplied by 0.4, or 240 watts per square metre. Across 1,000 square metres that is 240 kilowatts of instantaneous cooling load.
- The interior shading intercepts 60 percent of it, a composite of fabric openness and coverage. Dark, heavy fabrics do better; pale sheer fabrics do considerably worse.
- Thirty percent of the intercepted heat comes back indoors as secondary heat. The air layer between fabric and glass warms up, part of it passes inward through the gaps by convection, part returns as long-wave radiation. The closer the fabric sits to the glass, the higher this share.
- Net reduction equals 240 multiplied by 60 percent multiplied by 70 percent, or about 101 kilowatts.
5.3 Step three: the result and its order of magnitude
101 kilowatts multiplied by 43 yuan multiplied by six months comes to about 26,000 yuan. Running the sensitivity across 50 to 70 percent interception and 25 to 40 percent secondary heat gives 80 to 120 kilowatts, or 21,000 to 31,000 yuan per cooling season.
That 26,000 is the demand account only. The energy account is a separate book, worked through by kilowatt-hour in what 1,000 square metres of curtain wall saves in a year. The two cannot be added together. The same intercepted heat has already been subtracted once in the demand column; subtracting it again in the kilowatt-hour column is double counting. It is the most common error in calculations of this kind, and the people writing the proposals often do not notice they are making it.
One more thing belongs here rather than in a footnote. This is not a promise to save 26,000 yuan a year. It is an order-of-magnitude judgement answering a narrower question: is there roughly one hundred kilowatts inside this building peak that came in through the glass? If there is, the money is already on the bill and nobody has looked at it. If there is not, nothing installed at the window will help.
5.4 Three uncertainties
Orientation. West is the steepest, a near-vertical climb between three and six in the afternoon. Southwest comes next, with the peak arriving earlier. Due south peaks around noon but holds for longer, so the total shed over the day may be no smaller. East peaks in the morning, out of phase with the system peak. Such a building may see no movement in its demand charge while its morning cooling energy falls quite clearly.
Fabric. Openness, weight, colour, whether the yarn is metallised. Two fabrics on the same window can differ by twenty percentage points in interception. Choose on colour alone and the result will usually be the good-looking, ineffective kind.
Operating habit. Who draws it, at what hour, whether the lights go on afterwards, whether anyone retracts it at the end of the day. This is the most common failure and the one proposals leave out. Installed but never drawn is the same as not installed. Drawn and never retracted blocks winter daylight, and the lighting load goes up instead.
6. Shading handles the daytime, storage handles the timing, demand response handles the moment
6.1 Where the three sit on the curve
| Measure | What it moves | When it works | What it cannot touch |
|---|---|---|---|
| Shading, window screen | The height of the peak | Daytime with direct sun | Night, overcast days, equipment load |
| Storage | The position on the time axis | When a spread exists to charge and discharge against | Monthly total volume |
| Demand response | The instant of the peak | Called or bid periods | Normal operation |
These are not substitutes for one another. That sounds like a way of avoiding a recommendation, but it happens to be accurate: shading lowers the height of the curve, storage moves it along the axis, demand response yields only at the moment it is called. A building bill has to be read for both height and shape.
6.2 What an interior screen stops, and what it does not
It stops the radiant heat that has already entered the room. Before that heat becomes cooling load it is held in the air layer between fabric and glass and partly carried away by convection through the gaps at top and bottom. That is where its efficiency comes from, and it is also why it has to sit indoors. Stopping heat outside the glass is external shading, a different product. One confusion deserves a line of its own: blocking light is not the same as blocking heat. Most reports of shading that made no difference fail at exactly this step.
What it cannot stop is the portion the glass itself has already absorbed. Solar radiation reaching the glass is partly transmitted, partly reflected and partly absorbed; the absorbed share raises the inner surface temperature, which then keeps feeding the room by long-wave radiation and convection. An interior screen does nothing about that. Nor does it stop conduction through aluminium frames and slabs.
So the ceiling is definable. On an existing west-facing curtain wall with single glazing or ordinary insulating glass and no external shading, the ceiling is fairly high, and the hundred-kilowatt magnitude in section 5.2 is within reach. Most retrofit work sits in this group, which is what the retrofit era is largely made of. On a new tower already built with triple glazing, double-silver low-e and external shading, the margin is small; there the screen is bought for view and glare, and energy is the wrong justification. Better to say this up front than to be caught out later.
Product figures as stated on the manufacturer site: visible light transmission 88 percent, infrared rejection 96.5 percent, UV rejection 99 percent, shading coefficient 0.14, B1 fire rating. The B1 item will be asked about at public building acceptance, so have the test report ready before the fire inspection, not on the day.
6.3 Turning a human action into an operating rule
The first three months after installation decide whether projects of this kind work. Three rules can be copied directly.
First, a radiation threshold. Draw the screen when irradiance on the west glass exceeds 500 watts per square metre, retract below 200. This needs no weather station, only a small sensor on the facade.
Second, a time window. Default to drawn between 13:00 and 18:00 from May to October, overridden by the radiation threshold on overcast days. Do not rely on the cleaning or admin staff to remember.
Third, interlock with the chillers. Draw first, wait ten minutes, then read the return air temperature. Reverse the order and the conclusion will be that the screen does nothing, when in fact the cooling output had already saturated before the fabric came down.
Night-time and heating season follow different logic. One west-facing office retrofit, logged hour by hour, gives a usable reference; the winter checklist belongs to another article and is not repeated here.
7. Four questions
7.1 Will household bills rise now that the fixed schedule is gone
Not because of this document. Households, agriculture and public-interest consumption sit outside the reform, and both the tiered tariff and the residential time-of-use tariff continue as before. Small and medium users on grid agency purchasing remain on government-set prices with little change. What actually floats is the fully market-based large industrial and commercial user.
7.2 Can the demand charge be converted to a capacity charge
Two-part users may choose: bill on maximum demand, or bill on transformer capacity. One of the two. A rough way to decide is to multiply the capacity rate by contracted capacity and compare that with the demand rate multiplied by actual maximum demand. A building with chronically idle contracted capacity usually does better on demand; a building with a flat profile that runs close to its capacity may do better on capacity. The detailed rules differ by province, so ask the local grid business office rather than deciding on the numbers printed here.
7.3 If shading is installed, will the demand charge definitely fall
No. It depends on whether the building peak is caused by the windows. The test is not complicated: pull the fifteen-minute demand curve for July and overlay the facade irradiance curve for the same period. If the two peaks coincide, the window contribution is significant. If demand peaks in the evening or at night, the driver is equipment, lighting or process load, and shading will not help. Read the curves before discussing the scheme. That step cannot be skipped.
7.4 With the peak-valley spread gone, does storage still pay
Only the boundary, no assessment. Once the fixed peak-valley spread is withdrawn, the fixed arbitrage model does fail, because that spread was set by government and could be planned against. Spot spreads fluctuate more widely, which offers more opportunity but cannot be known in advance and requires forecasting and trading capability. How to underwrite that investment is beyond the scope of this article and beyond what I can judge.
Closing: three questions worth taking to your supplier and your property manager
First: on this building fifteen-minute demand curve for last July, what time did the peak fall, and what was the maximum demand in kilowatts for that month?
Second: in the new contract, how are the floating price and the K sharing coefficient set, and can you run a simulated settlement on last year actual curve, on a like-for-like basis?
Third: which facades on this building have no external shading, and are the meeting rooms that overheat after three in the afternoon the same rooms every time?
Answer those three and it becomes fairly clear which step comes first. Policy moves quickly; the structure of a bill moves slowly, and the slow end is usually where the money sits. To run the numbers for your own orientation, glass build-up and local tariff table, send us the parameters and we will use the same method: whatever it comes out to is what we report.